

Landing page optimization is not a one-time tweak. It is a structured, repeatable process of diagnosing what is broken, forming hypotheses, testing changes, and compounding the wins. When done right, every cycle lowers your cost per lead and pushes more qualified prospects into your pipeline. Most teams skip the diagnosis and jump straight into redesigning buttons. That is why their conversion rates stay flat.
Why Your Landing Page Isn’t Converting (And It’s Not the Design)
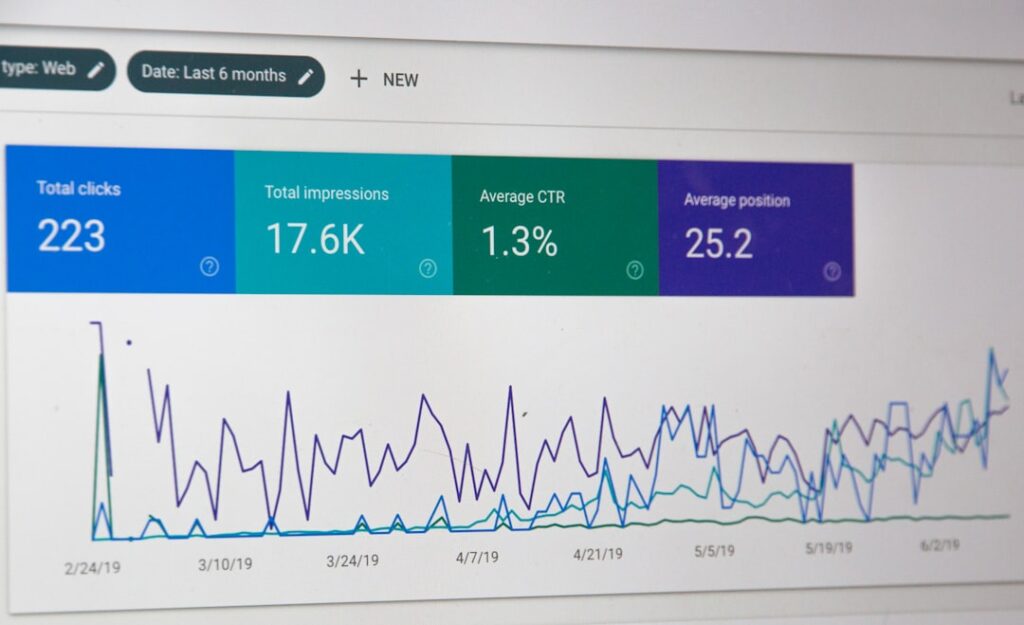
Your landing page has a conversion problem, and it almost certainly is not the visual design. The most common killers are messaging gaps, weak positioning, and friction in the user journey. A beautiful page that does not communicate value within five seconds will lose visitors regardless of how polished it looks. The same applies to pages with unclear calls-to-action, forms that ask for too much too early, or social proof buried below the fold where nobody scrolls.
Here is what happens: a visitor clicks your ad, arrives on the page, and within seconds decides whether to stay or leave. If your headline does not match the promise of the ad they clicked, they bounce. If your value proposition is vague, they lose interest. If your CTA is buried or generic (“Learn More”), they do not know what to do next. If your form has eight fields and no trust signals, they abandon it. Each of these is a fixable leak, not a design problem.
The businesses that win treat their landing page as a client acquisition system, not a creative project. They measure what matters, fix what is broken, and iterate relentlessly. That is what the 90-day framework below is built to do.
The 90-Day Landing Page Optimization Framework
This framework breaks landing page optimization into three thirty-day phases: diagnose, test, and compound. Each phase has a single objective and a set of deliverables. You do not move to the next phase until the current one is complete. Rushing is how teams end up with a pile of half-finished tests and no clear signal on what moved the needle.
Phase 1 (Days 1 to 30): Diagnose Before You Touch Anything
The first thirty days are about understanding why your page underperforms. You are not changing anything yet. You are gathering data, analyzing user behavior, and building a prioritized list of problems. This is the phase most teams skip, and it is the one that determines whether your tests produce meaningful results or noise.
Set Up Your Analytics and Heatmap Stack
Before you can diagnose, you need instrumentation. If you do not have session recordings and heatmaps running, you are flying blind. Install a behavior analytics tool (Hotjar, Microsoft Clarity, or similar) alongside your existing analytics platform. You need to see where visitors click, how far they scroll, where they rage-click, and at what point they abandon the page.
Check your page speed. A page that loads in over three seconds on mobile will lose a significant portion of visitors before they ever see your headline. Run it through Google PageSpeed Insights and document the score. Speed is revenue, and a slow page undermines every other optimization you make.
Audit the Seven Conversion Levers
Work through each lever methodically. Document what you find in a spreadsheet so you can prioritize later.
1. Hero copy. Does your headline communicate the specific outcome your visitor wants? “We help B2B SaaS companies reduce churn by 30% in 90 days” beats “Transform your business with innovative solutions.” If your hero does not pass the five-second test, it is your highest-priority fix.
2. Value proposition clarity. Can a first-time visitor understand what you do, who you serve, and why you are different within the first scroll? If not, your positioning needs work before anything else.
3. CTA placement and language. Is your primary call-to-action visible above the fold? Does the button text describe the action and the value (“Get My Free Audit” vs. “Submit”)? Generic CTAs underperform specific, outcome-driven ones every time.
4. Social proof. Do you have testimonials, case studies, client logos, or metrics visible near the point of decision? Trust signals placed too low on the page are invisible to the majority of visitors who never scroll past the first screen.
5. Form friction. How many fields does your form require? Every additional field reduces completion rate. If you are asking for phone number, company size, and budget on a first touch, you are filtering out qualified prospects who are not ready to commit that level of detail.
6. Message-match with traffic source. Does the page deliver on the promise of the ad or link that sent the visitor there? A mismatch between ad copy and landing page headline is one of the top causes of bounce on paid traffic.
7. Page speed and mobile experience. Test on a real mobile device, not just a responsive preview in your browser. If the layout shifts, the tap targets are too small, or the form is unusable on mobile, you are losing the majority of your traffic.
| Conversion Lever | What to Audit | Common Problem | Priority |
|---|---|---|---|
| Hero copy | Headline clarity and specificity | Vague, feature-focused headline | High |
| Value proposition | First-scroll positioning | No clear differentiation | High |
| CTA placement | Above-the-fold visibility | Generic button text, buried CTA | High |
| Social proof | Proximity to decision point | Testimonials too low on page | Medium |
| Form friction | Field count and required fields | Too many fields for first touch | Medium |
| Message-match | Ad-to-page headline alignment | Ad promise differs from page | High |
| Page speed | Mobile load time and Core Web Vitals | 3+ second load on mobile | High |
By the end of Phase 1, you should have a prioritized list of issues, each with supporting data from your analytics and heatmaps. Rank them by expected impact and effort. You are now ready to test.
Phase 2 (Days 31 to 60): Run High-Impact Tests First
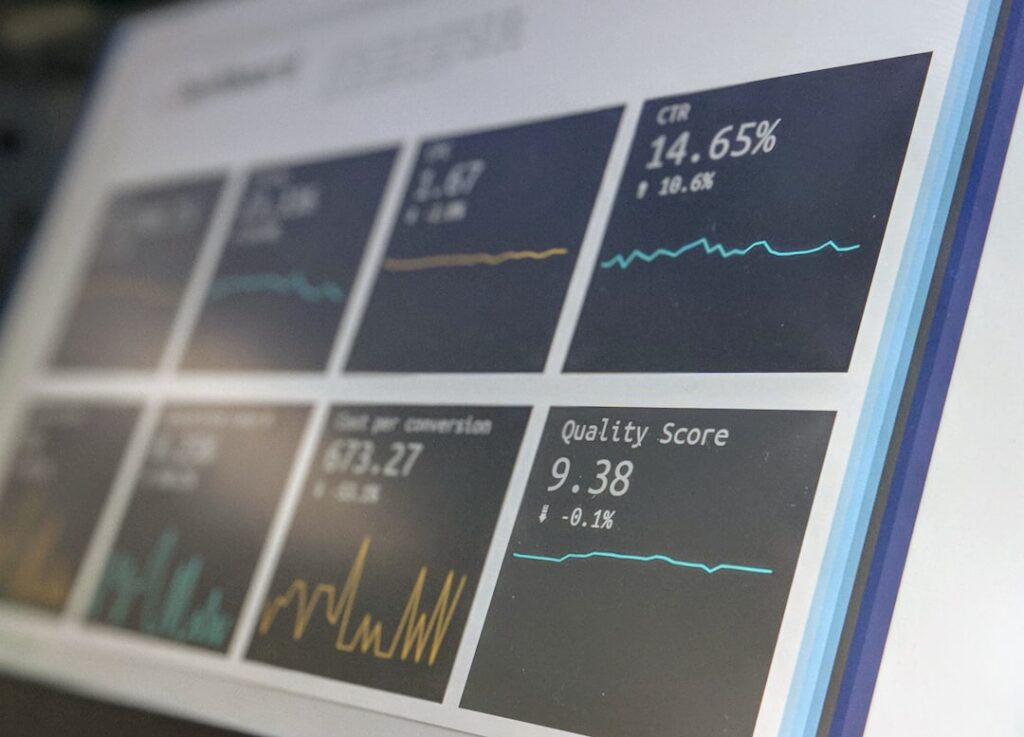
Now you start testing. The rule is simple: test the highest-impact, lowest-effort changes first. Do not start with button colors. Start with the levers that have the greatest potential to move conversion rate: your headline, your CTA language and placement, and your form length.
Test 1: Rewrite Your Hero Headline
Your headline is the single most important element on the page. It determines whether visitors stay or leave. Test a headline that leads with the specific outcome your prospect wants, not what your company does.
Before: “Innovative Marketing Solutions for Growing Businesses”
After: “Cut Your Cost Per Lead by 40% in 90 Days”
Run this as an A/B test. Your control is the current headline. Your variant is the outcome-focused version. You need enough traffic to reach statistical significance, which typically means at least a few hundred conversions per variant. If your traffic is low, consider running sequential tests instead, though they are less reliable.
Test 2: Restructure Your CTA
Test two things: the language on the button and its placement. Replace generic CTAs like “Submit” or “Learn More” with action-and-value phrasing: “Get My Free Strategy Call,” “Start My Audit,” “Book My Consultation.” Then test placing a second CTA lower on the page, after the social proof section, to capture visitors who need more context before acting.
Test 3: Reduce Form Friction
Cut your form to the minimum fields needed to qualify the lead. For most service businesses, that is name and email for a first touch. If you need more, use a multi-step form that asks one or two questions per step rather than a long single form. Multi-step forms reduce perceived effort and consistently outperform long single-screen forms.
Test 4: Move Social Proof Up
If your testimonials are buried at the bottom of the page, move at least one above the fold or directly beneath the hero section. A single, specific testimonial with a name, photo, and measurable result (“We closed 12 new clients in the first quarter”) outperforms a wall of vague five-star ratings.
Run one test at a time per page element. If you change the headline and the CTA simultaneously, you will not know which change drove the result. Discipline here is what separates real optimization from guesswork.
Phase 3 (Days 61 to 90): Compound Your Wins and Lock In Gains
By Day 60, you should have clear winners from your first round of tests. Phase 3 is about locking in those gains and running a second wave of tests on the next tier of priorities. This is where landing page optimization starts to compound.
Implement and Document Winners
Ship your winning variants as the new control. Document what you tested, what won, and by how much. This record becomes your institutional knowledge. When you onboard a new team member or run the next cycle, you do not start from scratch. You start from your last known best version.
Run the Second Wave
Move to the next items on your prioritized list. This is where you test the medium-priority levers: subheadline copy, benefit-driven bullet points, objection-handling sections, and the specific social proof formats (video testimonials vs. text, client logos vs. case study snippets). Each test builds on the last.
Set Up a Continuous Optimization Loop
The 90-day framework is not a one-and-done exercise. It is a cycle. After Day 90, start again: review your analytics, identify the next set of leaks, form new hypotheses, and test. The businesses that maintain this rhythm see compounding improvements in conversion rate and cost per acquisition over time. The ones that stop after one round plateau and eventually decline as traffic quality and market conditions shift.
If your team does not have the in-house expertise to run this loop effectively, that is where futurelinkz.com comes in. We build and optimize landing pages as part of a broader client acquisition system, with conversion architecture and copywriting engineered from the ground up.
The Metrics That Actually Matter

Vanity metrics will mislead you. Page views, time on page, and bounce rate are interesting context, but they do not tell you whether your landing page is working. Focus on the metrics that tie directly to revenue.
Conversion rate: The percentage of visitors who complete your primary action (form submission, booking, call scheduling). This is your headline metric. Track it per traffic source, because a 5% conversion rate from organic search and a 1% rate from cold paid ads tell very different stories.
Cost per acquisition (CPA): What you spend to acquire one qualified lead. As your conversion rate improves, your CPA drops. This is the metric that makes optimization measurable in dollars.
Lead quality: A higher conversion rate means nothing if the leads are unqualified. Track how many form submissions convert into sales conversations or closed deals. If your optimization increases volume but decreases quality, you are optimizing the wrong thing.
Form abandonment rate: The percentage of visitors who start but do not complete your form. A high abandonment rate points directly to friction in the form itself.
Scroll depth: How far visitors scroll before leaving. If 70% of visitors never reach your social proof section, it does not matter how good those testimonials are. They are invisible.
Track these metrics weekly during the 90-day cycle. Compare each phase against the previous one. The goal is not a single spike in conversions after one test. The goal is a sustained, measurable improvement in lead volume and quality by the end of Day 90 and beyond.
Landing page optimization works when it is treated as a system, not a sprint. Diagnose thoroughly. Test with discipline. Compound your wins. Repeat. If you want a partner who can run this process with you, book a free strategy call with futurelinkz.com. No obligation, response within 24 hours. Tell us about your current landing page and what a high-converting version could look like for your business.
Frequently Asked Questions
What is landing page optimization?
Landing page optimization is the structured process of improving a page’s conversion rate through data-driven diagnosis, hypothesis-based A/B testing, and iterative improvements. It focuses on changes to messaging, CTA placement, social proof, and form friction rather than visual redesign.
Why is my landing page not converting?
Most landing pages fail to convert because of weak hero copy, unclear value propositions, generic CTAs, excessive form fields, and social proof placed too low on the page. These are messaging and architecture problems, not design problems.
What should I test first on my landing page?
Start with the highest-impact, lowest-effort changes: rewrite your hero headline to lead with a specific outcome, restructure your CTA language and placement, and reduce form fields to the minimum needed to qualify a lead.
How much traffic do I need to run A/B tests?
At minimum a few hundred conversions per test variant are needed for statistical significance. If your traffic is low, consider running sequential tests, though they are less reliable than simultaneous A/B tests.
How often should I optimize my landing page?
Landing page optimization should be an ongoing cycle, not a one-time project. A 90-day framework gives you a structured starting point: 30 days of diagnosis, 30 days of high-impact tests, and 30 days of compounding wins. After that, repeat the loop.